Understanding the Moving Average: Definition, Types, and Strategies
The moving average is one of the most widely used tools in technical analysis, helping traders smooth out price data to better understand market trends. It’s a powerful yet straightforward indicator that can assist in identifying entry and exit points. Whether you’re a beginner or an experienced trader, using moving averages can help you make more informed decisions by reducing market noise and highlighting significant price movements.
What is a Moving Average?
A moving average is a statistical calculation that averages the price of an asset over a specific time period. It is commonly used in trading to analyze trends, identify potential reversals, and determine support and resistance levels. Moving averages help traders eliminate the noise caused by short-term price fluctuations and gain a clearer view of the market direction.
The moving average is calculated by taking the average of an asset’s price over a chosen period, such as 10 days, 20 days, or 50 days. As new data points are added, the oldest ones are removed, creating a “moving” average that continuously adjusts to market changes.
Types of Moving Averages
There are three main types of moving averages, each with its own unique characteristics:
- Simple Moving Average (SMA): The SMA calculates the average of an asset’s price over a specific period. Each price point within the time frame is given equal weight. As a result, the SMA is easy to understand but can be slower to react to sudden market movements.
- Exponential Moving Average (EMA): The EMA gives more weight to recent prices, making it more responsive to market changes. This type of moving average is often preferred by traders looking for quicker signals, as it reacts faster to price movements than the SMA.
- Weighted Moving Average (WMA): Similar to the EMA, the WMA assigns more weight to recent prices, but it uses a different formula to calculate the average. This makes it even more sensitive to recent price movements compared to the EMA.
How to Use Moving Averages in Trading
Moving averages serve various purposes in trading. They help traders identify trends, predict future price movements, and spot potential entry and exit points. Here’s how moving averages work:
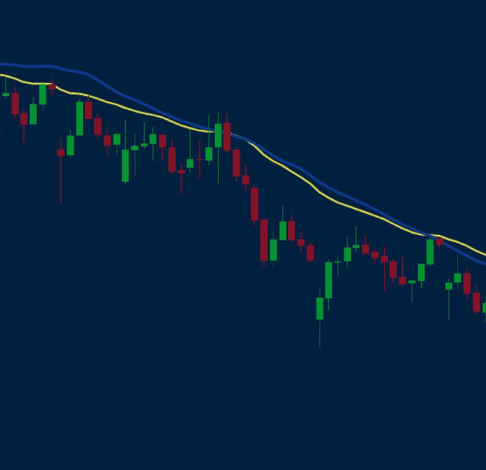
- Trend Identification: The direction of the moving average indicates the market’s general trend. If the moving average is rising, it suggests an uptrend; if it’s falling, it indicates a downtrend; and if it’s flat, the market is likely in a range-bound phase.
- Support and Resistance: Moving averages often act as dynamic support and resistance levels. When the price is above the moving average, it can act as a support level, and when the price is below it, the moving average may act as resistance.
- Crossovers: A common strategy involves looking for crossovers between different moving averages. For example, when a shorter-term moving average crosses above a longer-term moving average, it signals a potential buy (a “Golden Cross”). Conversely, when the shorter-term average crosses below the longer-term one, it suggests a potential sell (a “Death Cross”).
Advantages of Moving Averages
- Simplicity: The moving average is a straightforward tool that can be easily interpreted. A clear upward or downward slope of the moving average helps traders gauge market direction at a glance.
- Trend Confirmation: Moving averages are excellent at confirming trends by smoothing out the volatility in the market. They can help filter out the noise that makes it difficult to spot underlying market movements.
- Improved Entry and Exit Points: Moving averages can help traders identify optimal entry points in trending markets. They provide insight into when to enter or exit based on price movement relative to the moving average.
- Noise Reduction: Moving averages help traders focus on the broader trends by filtering out the daily price fluctuations. This is particularly useful in volatile markets.
Popular Moving Average Trading Strategies
There are various strategies that traders use with moving averages. Here are some of the most common:
- Trend Trading: In a strong trend, prices generally stay above or below the moving average, making it easier to follow the trend. For example, in an uptrend, prices tend to remain above the moving average, and traders can look for opportunities to buy when the price touches the moving average, signaling support.
- Golden and Death Cross: This strategy involves two moving averages, usually the 50-day and 200-day SMAs. A “Golden Cross” occurs when the short-term average crosses above the long-term average, signaling a potential buy. Conversely, the “Death Cross” happens when the short-term average crosses below the long-term average, signaling a potential sell.
- Bollinger Bands: This strategy uses a 20-day SMA in the middle of the bands. The upper and lower bands are typically set two standard deviations away from the SMA. Traders watch for price movements near the bands and use the SMA as a dynamic support or resistance level.
- Retracement Trading: Traders often use Fibonacci retracement levels along with moving averages to identify potential pullbacks in a trend. A retracement occurs when the price temporarily moves against the prevailing trend before continuing in the original direction. Moving averages can help confirm whether the retracement is likely to continue or reverse.
Conclusion
Moving averages are essential tools in technical analysis, offering a simple and effective way to identify trends, assess market direction, and make better trading decisions. Whether you use them alone or in combination with other indicators, moving averages provide valuable insights into market behavior and help traders refine their strategies. As you become more familiar with how moving averages work, you’ll be able to apply them more effectively to capture profitable opportunities in both trending and range-bound markets.